Instantaneous Spectra
A component set Array{Tuple{Function,Function,Real},1} maps to an instantaneous spectrum (IS).
The two-dimensional (2-D) IS in the time-frequency coordinates for a signal expressed with set of canonical triplets ${\mathscr{S}=\{\mathscr{C}_0,\mathscr{C}_1,\cdots,\mathscr{C}_{K-1}}\}$ is given by
\[\mathcal{S}(t,\omega;\mathscr{S}) = 2 \pi \sum\limits_{k=0}^{K-1} \psi_k\left( t ; \mathscr{C}_k \vphantom{0^0}\right)\,\delta\left(\vphantom{0^0}\omega-{\omega}_k(t)\vphantom{0^0}\right)\]
and three-dimensional (3-D) IS in the time-frequency-real coordinates is given by
\[\mathcal{S}(t,\omega,s;\mathscr{S}) = 2 \pi \sum\limits_{k=0}^{K-1} \psi_k\left( t ; \mathscr{C}_k \vphantom{0^0}\right) ~{}^{2}\delta\left(\omega-\omega_k(t),s-s_k(t)\vphantom{0^0}\right).\]
Visualization for ISs are provided in the ISA module.
using ISAVisualizing an Instantaneous Spectrum
We can visualize a 3-D IS as follows. First, define a component set.
a₀(t) = exp(-t^2)
ω₀(t) = 2.0
φ₀ = 0.0
𝐶₀ = (a₀,ω₀,φ₀)

a₁(t) = 1.0
ω₁(t) = 10*t
φ₁ = 0.1
𝐶₁ = (a₁,ω₁,φ₁)

a₂(t) = 0.8*cos(2t)
ω₂(t) = 10 + 7.5*sin(t)
φ₂ = π
𝐶₂ = (a₂,ω₂,φ₂)

𝑆 = [𝐶₀,𝐶₁,𝐶₂]
Then, pass the component set Array{Tuple{Function,Function,Real},1} and a time index Array{Float64,1} to the function isaPlot3d().
t = 0.0:0.005:2.0
isaPlot3d(𝑆, t)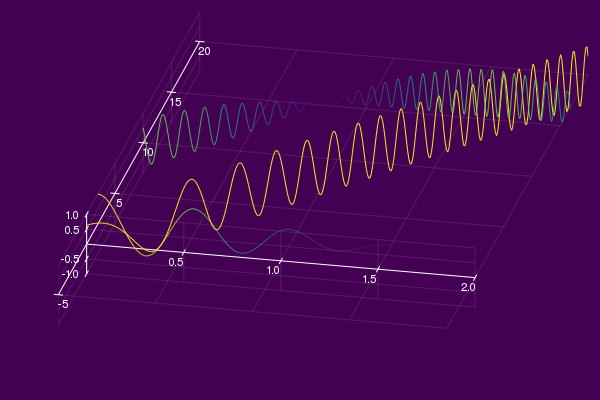
NOTE: isaPlot3d() is still under development.
~!~ MORE/BETTER VISUALIZATION TOOLS ARE CURRENTLY IN DEVELOPMENT ~!~